Running services and keeping them running are two different things. The second part is what catches most people off guard, especially when you're the only one responsible.
This article covers how I set up Uptime Kuma together with ntfy to monitor all my services and get phone notifications within seconds when something goes down.
Prerequisites
- A server with Windows or Linux running 24/7 (a Raspberry Pi works fine)
- 1 vCPU, 512 MB RAM, 1 GB storage
- sudo access and Docker Compose installed
Why I stopped using cloud monitoring tools
When I first started self-hosting, I had no idea when things broke. A Docker container silently failing after a restart, a website update that took the whole site down — I'd only find out hours later, usually from someone else.
My first attempt at a fix was UptimeRobot, then Betterstack. Both work fine, but I kept hitting the free tier ceiling: marketing emails, dashboards clearly designed for ops teams, way more features than I needed. I just wanted to know if my stuff was up.
Then I was browsing GitHub one day and noticed a friend had starred a project called Uptime Kuma. I clicked through, saw the screenshots, and that was it. Clean UI, open source, self-hosted. Over 80k stars means the project works and is actively maintained. I was sold before I even read the docs.
Getting it running
I run everything with Docker, and Uptime Kuma already ships a docker-compose.yaml in the repository.
Below is the compose file I use. It includes both Uptime Kuma and ntfy — the push notification service I'll cover in the next section:
services:
  uptime-kuma:
    image: louislam/uptime-kuma:2
    container_name: uptime-kuma
    volumes:
      - uptime-kuma-data:/app/data
    ports:
      - "127.0.0.1:4000:3001"
    restart: unless-stopped

  ntfy:
    image: binwiederhier/ntfy
    container_name: ntfy
    command:
      - serve
    environment:
      - NTFY_BASE_URL=https://ntfy.your-domain.dev
      - NTFY_UPSTREAM_BASE_URL=https://ntfy.sh
      - NTFY_BEHIND_PROXY=true
      - TZ=UTC
    user: "1000:1000"
    ports:
      - "127.0.0.1:8080:80"
    restart: unless-stopped

volumes:
    uptime-kuma-data:
On first launch, Uptime Kuma asks which database to use. I always pick SQLite — it's lightweight, needs no extra setup, and works perfectly for personal use. A full database setup only makes sense if you want to query your data from Grafana, run multiple instances, or need proper dump/restore workflows.
After that, create an admin account so nobody else can touch your config. That's the whole setup.
Configuring monitors
Adding a monitor takes about 30 seconds. Pick a name, choose a type, set the check interval. I currently use three types:
- HTTP(S): checks that a URL responds successfully. I use this for my websites (danobe.dev and carpf.it) and for any service that exposes a web interface.
- Ping: sends a ping to an external server. I target Google's servers — if this fails, my internet connection is down, not the service itself.
- Push: the service sends a heartbeat to Uptime Kuma on a fixed schedule. I use this for Beszel, which monitors my server's hardware resources. When the heartbeat stops arriving, Uptime Kuma triggers an alert.
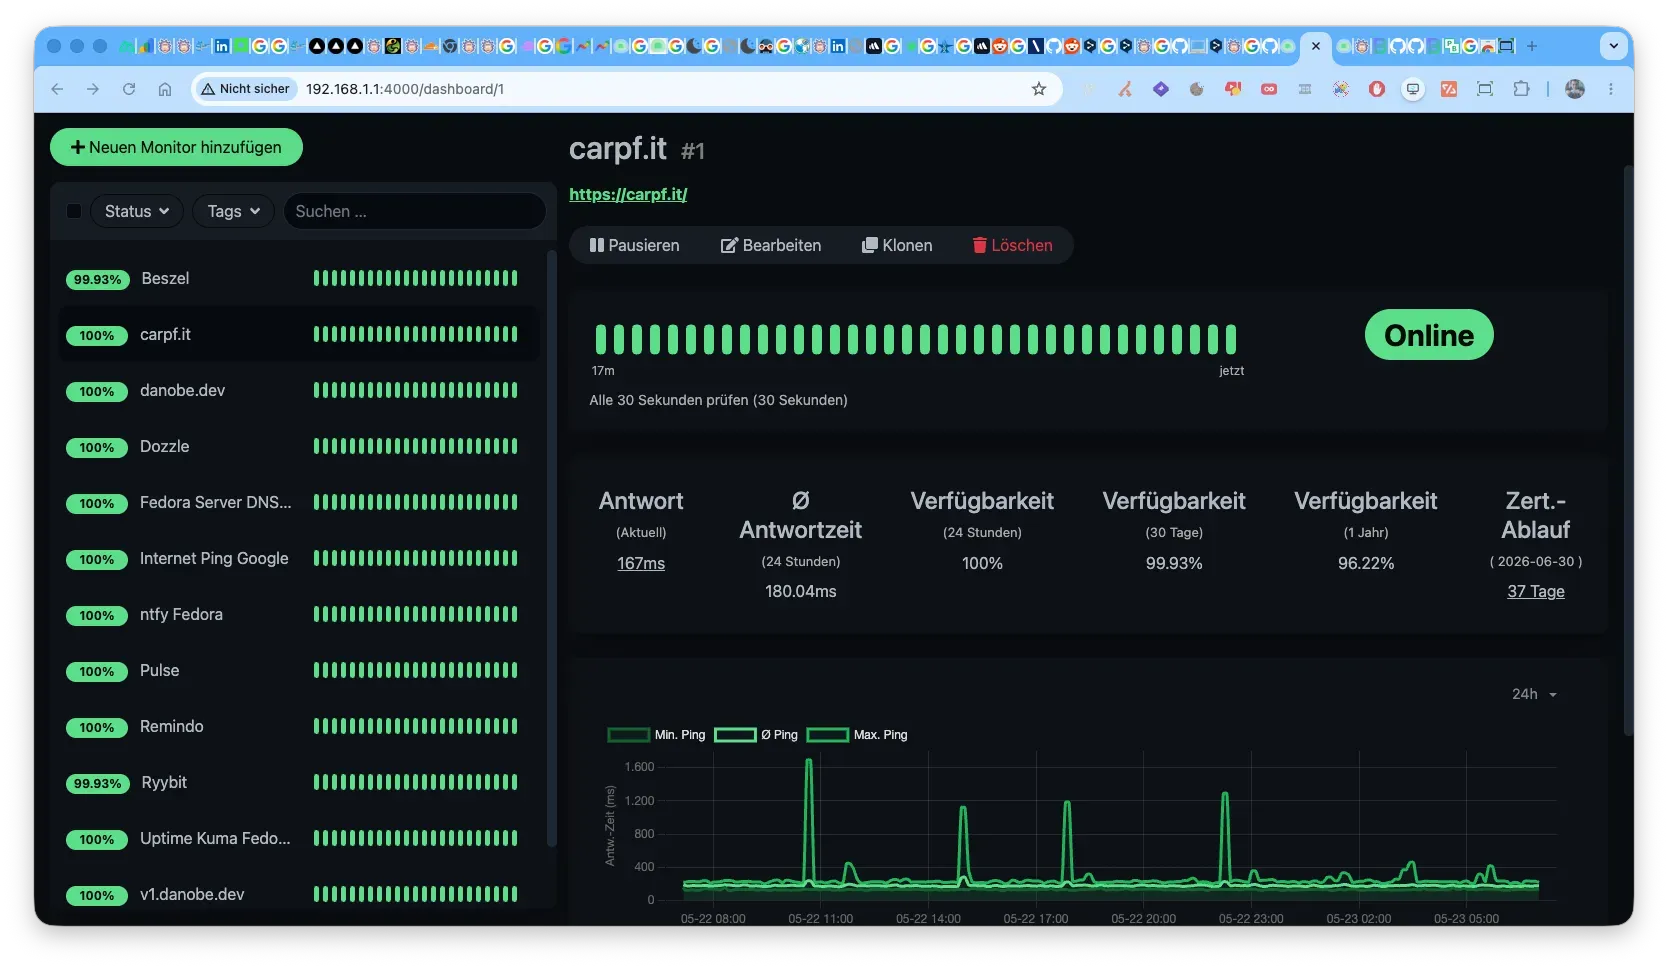
My current setup looks like the screenshot above — every monitor shows its status, response time history, and uptime percentage at a glance.
Getting notified on your phone with ntfy
Knowing something is broken is only useful if you find out in time. I use ntfy for alerts — it has apps for iOS and Android, and a PWA for macOS.
You can use the free hosted service at ntfy.sh, but I run my own instance for full control. It's already in the compose file above. Once it's running, connect it to Uptime Kuma through the notification settings — there's a built-in ntfy integration. From there, any failed check pushes a notification to my phone within seconds.
I also use ntfy in other places: backup scripts that notify me when a job starts and when it finishes. One curl command is all it takes:
curl -d "Backup finished" https://ntfy.your-domain.dev/Backups
Drop that into any bash script or cron job. It's a small thing, but it removes a lot of "wait, did that actually run?" uncertainty.
A few more features worth knowing
Status page — Uptime Kuma can generate a public-facing status page you can link to from your website. Useful if you have clients or users who want to check whether something is down without contacting you. I haven't needed this yet for my setup, but it's a clean option to have.
Maintenance windows — You can define scheduled windows where alerts are suppressed. Practical for planned reboots: without this, a server going offline for two minutes floods your phone with notifications.
Docker container monitoring — It can also check whether specific containers are running, not just whether a URL responds. More precise for services where a web endpoint isn't the most reliable health signal.
Conclusion
If you run any services yourself, this combination is worth the hour it takes to set up. Uptime Kuma watches your infrastructure, ntfy gets the alerts to your phone, and you stop being the last person to find out when something breaks.
Comments
No comments yet — be the first!